
Heat Exchanger Fouling: The Overlooked Line Item in Maintenance Budgets
Heat exchanger fouling is the accumulation of scale, sediment, corrosion products, and biological deposits on heat transfer surfaces. The layer insulates the metal between the process fluid and the service fluid, so the unit has to work harder to reach the same duty. In industrial and commercial facilities, it is one of the main reasons maintenance costs climb.
The expense rarely stops at a single repair. A fouled exchanger burns extra pumping energy, wears components faster, and can force an unplanned shutdown that interrupts production. Add those effects up and fouling becomes one of the largest controllable items in a facility’s operating budget.
Two decisions shape that cost more than anything else: how often exchangers are cleaned, and which tube materials are specified. Cleaning schedules set how much deposit is allowed to build before performance degrades. Tube material sets how long corrosion and erosion resistance hold up under real operating conditions.
Four themes run through both decisions:
- Fouling mechanisms – how scale, sediment, corrosion products, and biological deposits form and behave
- Cleaning schedule timing – balancing cleaning frequency against downtime and labor
- Tube material selection – matching metallurgy to fluid chemistry and temperature
- Total cost trade-offs – weighing capital, energy, and maintenance spending across the equipment life cycle
The aim is a practical framework engineers and operators can use to treat fouling as a budget line they manage, not a variable they absorb.
What Heat Exchanger Fouling Actually Is
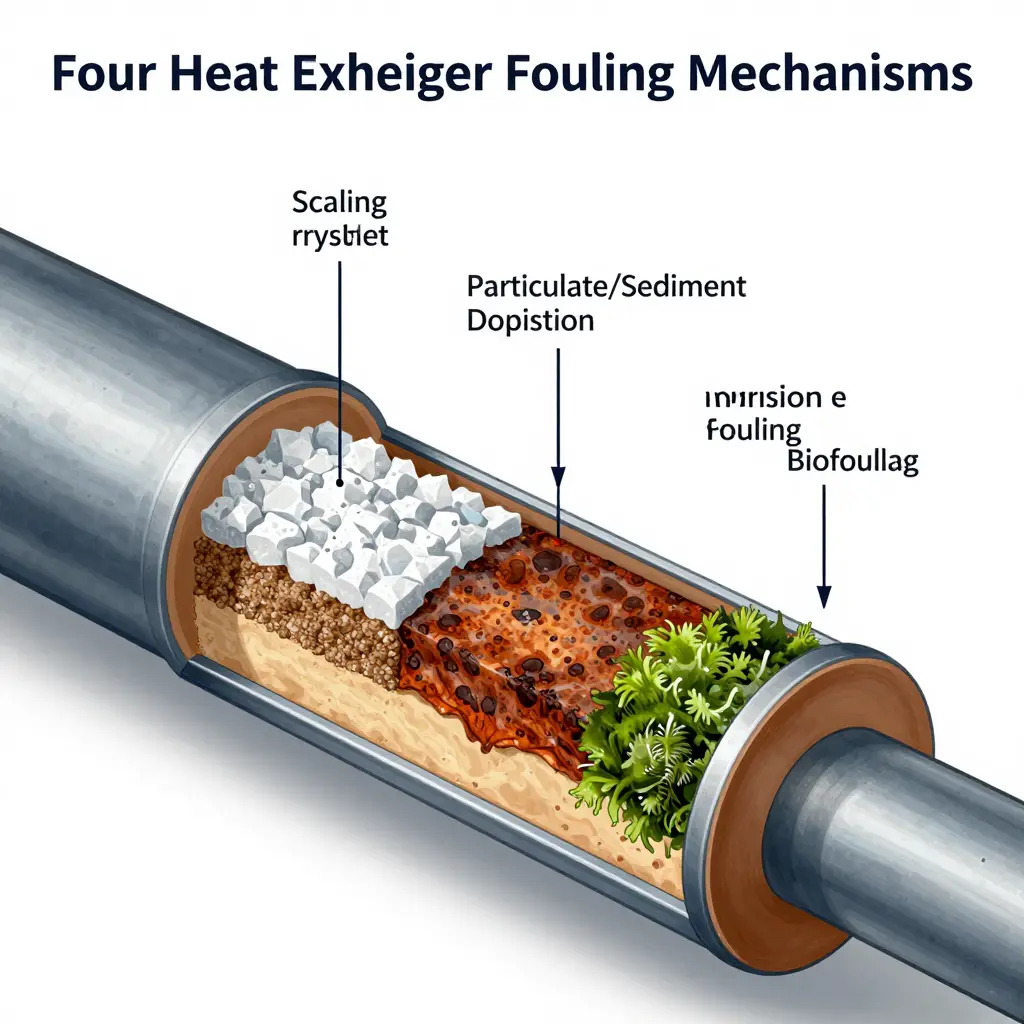
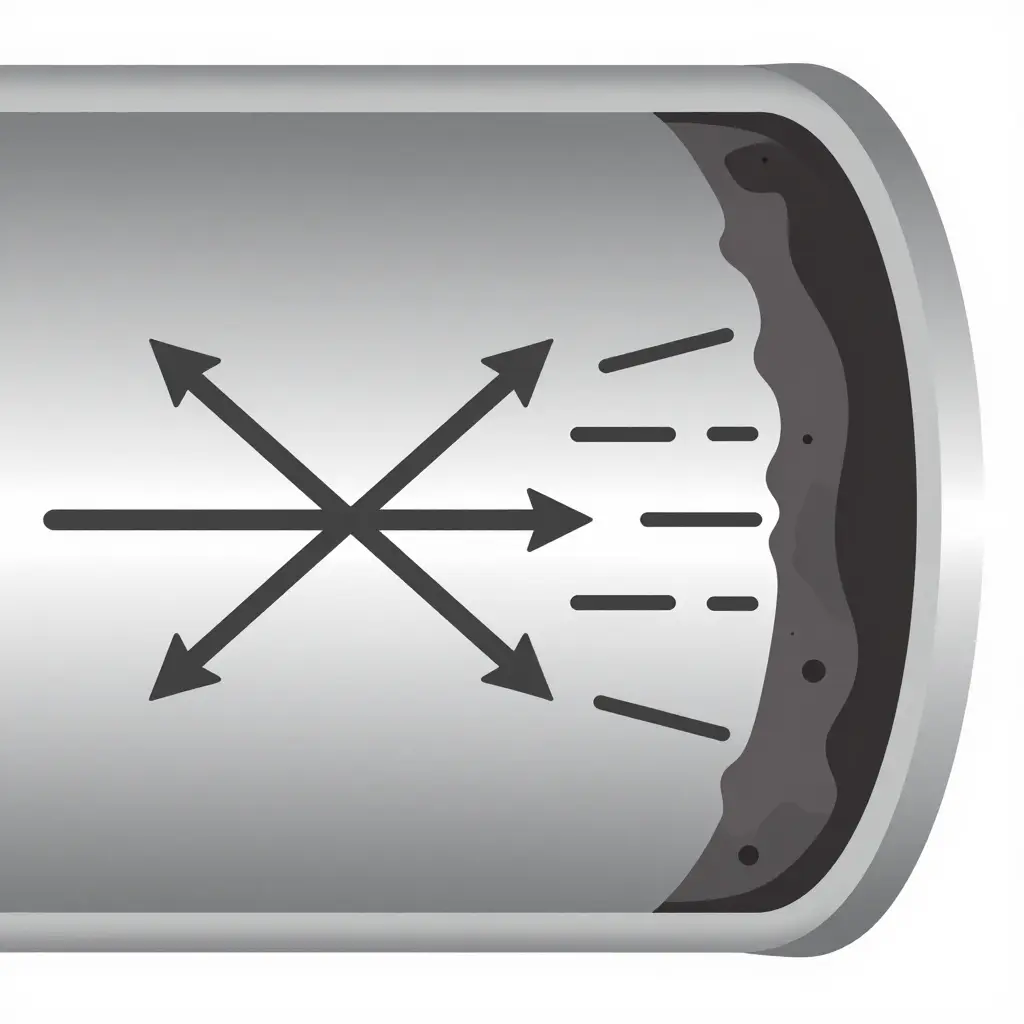
Fouling is unwanted material building up on heat transfer surfaces, forming an insulating layer between the hot and cold fluids and the metal that is supposed to move energy between them. That layer is thermal resistance, nothing more: a barrier heat has to cross. Designers allow for it with a fouling factor, an added resistance term (usually expressed in m2·K/W) built into the sizing so the unit still meets its duty after deposits form. Once that margin is gone, heat transfer efficiency falls and pressure drop climbs, and both push maintenance cost up. Fouling is usually grouped into five mechanisms, four of which dominate water and process service.
Scaling (Crystallization of Dissolved Salts)
Scaling happens when dissolved mineral salts in the water or process fluid pass their solubility limit and crystallize directly onto hot surfaces. Calcium carbonate, calcium sulfate, and silica are the usual offenders. Their solubility falls as temperature rises, so the hottest points – tube walls and heating surfaces – collect the hardest, most stubborn deposits.
- Physical process: ions come out of solution and build a dense crystalline layer that bonds tightly to the metal.
- What accelerates it: high wall temperatures, high dissolved-solids concentrations, elevated pH, and evaporation or concentration cycles.
- Heat transfer effect: scale has very high thermal resistance per millimeter, which makes it one of the fastest ways to erode heat transfer efficiency.
- Pressure drop effect: the thickening layer narrows the flow passages, steadily raising pressure drop across the unit.
Particulate and Sediment Deposition
Particulate fouling is the physical settling of suspended solids – sand, rust particles, clay, process debris – onto surfaces where flow slows or changes direction. It is mechanical rather than chemical, and it favors low-velocity zones.
- Physical process: particles drop out of suspension and pack into a soft-to-firm layer that may harden over time.
- What accelerates it: low flow velocities, poor filtration, upward-facing surfaces, and high suspended-solids loads.
- Heat transfer effect: deposits add thermal resistance and blanket the surface unevenly, lowering overall heat transfer efficiency.
- Pressure drop effect: this is usually the biggest pressure penalty of the four, since packed sediment can significantly restrict the flow path.
Corrosion Fouling
Corrosion fouling happens when the metal itself reacts with the fluid and the resulting products deposit on the surface. The film that forms is often a mix of metal oxides and salts adhering to the tube wall.
- Physical process: the base metal corrodes, and its oxide or salt by-products accumulate as a rough, adherent layer.
- What accelerates it: aggressive fluids, low pH, dissolved oxygen, high temperatures, and dissimilar-metal contact.
- Heat transfer effect: corrosion products and roughened surfaces add thermal resistance and cut heat transfer efficiency.
- Pressure drop effect: rough deposits increase surface friction and turbulence, raising pressure drop while also damaging the tubes themselves.
Biological Fouling (Biofouling)
Biofouling is the growth of living organisms – bacteria, algae, fungi, and their slimes – on wetted surfaces. It is the most common problem in cooling water systems, where warm, nutrient-rich water makes an ideal habitat.
- Physical process: microorganisms attach, secrete a sticky biofilm, and multiply into a slimy layer that traps debris.
- What accelerates it: warm temperatures, nutrients, sunlight, and stagnant or low-flow areas.
- Heat transfer effect: biofilms insulate the surface and add measurable thermal resistance, reducing heat transfer efficiency.
- Pressure drop effect: the slimy layer fouls passages and, with larger growth such as mussels, can increase pressure drop sharply.
Most real exchangers run two or three of these mechanisms at once, and each leaves its own signature. Working out which one dominates is what points you to the right cleaning schedule and the right tube material.
Fouling Mechanisms and Their Maintenance Impact
Each mechanism attacks heat transfer surfaces differently and carries its own maintenance cost profile. The table below maps the five most common types of heat exchanger fouling to their root causes, heat transfer penalties, preferred cleaning methods, and relative impact on maintenance cost. It works as a triage guide when you are setting inspection intervals or making the case for a tube-material upgrade.
| Fouling Mechanism | Primary Cause | Typical Effect on Heat Transfer | Preferred Cleaning Approach | Relative Impact on Maintenance Cost (Low/Medium/High) |
|---|---|---|---|---|
| Scaling | Crystallization of dissolved salts (calcium, magnesium) on hot surfaces | Sharp, steady drop in heat transfer as insulating layer thickens | Chemical descaling (acid/citric); softened feed water | High |
| Particulate and sediment fouling | Suspended solids settling out of low-velocity flow | Gradual, uneven loss of heat transfer; partial flow blockage | Mechanical brushing, hydro-blasting, or filtration upstream | Medium |
| Corrosion fouling | Reactive metal surfaces forming oxide or scale products | Rising thermal resistance plus surface pitting and potential leaks | Chemical cleaning plus corrosion-resistant tube material | High |
| Biological fouling | Bacterial, algal, or biofilm growth in warm, nutrient-rich water | Progressive heat transfer loss; supports under-deposit corrosion | Biocide dosing and mechanical cleaning | Medium to High |
| Chemical reaction fouling | Thermal or chemical breakdown depositing coke or polymer films | Rapid, hard-to-remove layer sharply reducing heat transfer | High-temperature chemical cleaning; controlled process conditions | High |
Reading the Table
- Scaling and chemical reaction fouling hit maintenance cost hardest. Both demand aggressive chemistry, and both tend to come back quickly.
- Particulate and biological fouling stay cheaper if routine monitoring catches them early.
- Matching the cleaning method to the mechanism avoids unnecessary tube damage and stretches service life.
Cleaning Schedules: Why Timing Determines Cost
The real cost of fouling is rarely about whether you clean a heat exchanger. It is about when. Two identical exchangers on the same fluid can produce very different lifetime costs depending only on how their cleaning schedules are set. The teams that spend the least are not the ones who clean most often; they clean at the right moment.
Calendar-Based vs. Condition-Based Schedules
Most facilities still default to calendar-based cleaning: a fixed date, a fixed runtime, the same interval for every unit. It is simple and predictable, but the fouling rate depends on fluid chemistry, temperature, velocity, and load, and a fixed interval cannot see any of that. A condition-based schedule turns the logic around. Cleaning happens when measured performance says it must, not when the calendar says it should.
| Factor | Calendar-Based Schedule | Condition-Based Schedule |
|---|---|---|
| Trigger | Fixed date or runtime hours | Measured performance indicators |
| Frequency | Same for every unit, every season | Adjusted to actual fouling rate |
| Over-cleaning risk | High | Low |
| Under-cleaning risk | High during heavy-load periods | Low |
| Labor planning | Predictable | Flexible, data-driven |
| Best suited to | Stable, low-value, non-critical units | Critical, high-energy-demand exchangers |
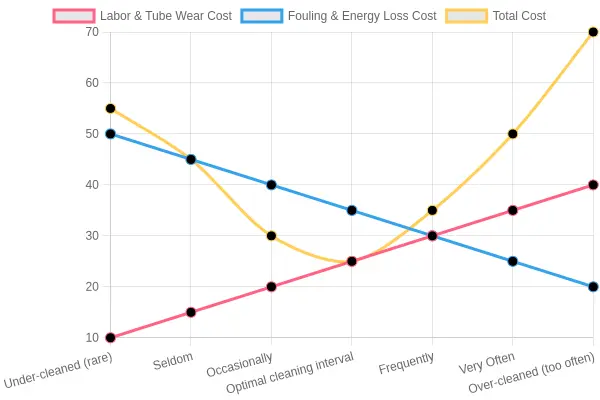
Why Getting It Wrong in Either Direction Costs You
Both errors are expensive, for different reasons.
- Over-cleaning wastes labor and, when it involves aggressive tube cleaning, takes metal with it. Every mechanical or hydro-blast pass strips protective oxide films and thins the wall, which speeds up corrosion and shortens equipment life. You end up wearing out an asset to keep it looking clean.
- Under-cleaning leaves the deposit in place as insulation. Approach temperature drifts upward, the heat transfer coefficient falls, and energy loss climbs. Pressure drop rises, pumps draw more power, and throughput drops. Left long enough, fouling can force unplanned shutdowns.
The chart below shows the trade-off as a U-shaped total-cost curve: labor and tube-wear costs rise with frequency, fouling and energy costs fall, and the two meet at a single optimal interval.
The Indicators That Set the Trigger
Condition-based cleaning is only as good as its monitoring. Three indicators do most of the work:
- Approach temperature – the smallest temperature difference between the two streams, usually the hot-side outlet against the cold-side inlet. It widens as fouling builds, which makes it the clearest early signal.
- Pressure drop – rising differential pressure across the exchanger means flow paths are narrowing. Track it against a clean baseline.
- Heat transfer coefficient – a declining coefficient quantifies lost thermal performance in a single number, ideal for trend lines and thresholds.
Continuous monitoring underpins any condition-based program, and it is the same principle that makes real-time monitoring systems for fleet safety effective: watch the trend rather than the snapshot, and act before the damage compounds.
Building a Condition-Based Cleaning Schedule
- Establish a clean baseline. Record approach temperature, pressure drop, and heat transfer coefficient immediately after a verified clean, at known flow and load conditions.
- Instrument and log. Fit reliable temperature and pressure sensors and capture readings on a regular interval, so you get a trend instead of a guess.
- Set trigger thresholds. Define the percentage drift that justifies intervention – for example, a 10% rise in pressure drop or a 15% decline in heat transfer coefficient.
- Schedule the tube cleaning. When a threshold is crossed, plan the work for the next available window instead of waiting for a fixed date.
- Verify and refine. After cleaning, re-measure against baseline and adjust the thresholds so your preventive maintenance program gets sharper each cycle.
The Takeaway
Timing, not frequency, decides whether a cleaning program protects the exchanger or wears it out. A calendar-based schedule is a guess, and the guess is wrong in both directions at different times of year. Approach temperature, pressure drop, and heat transfer coefficient together give you an early-warning signal, so you clean at the point where cost and performance balance.
Cleaning Methods at a Glance
Fouling rarely announces itself before efficiency drops or pressure differentials spike. Which cleaning method fits depends on the foulant type, the tube material, and how much downtime you can spare. Used alongside disciplined monitoring of operating conditions, this quick reference helps maintenance teams match the method to the job.
-
Mechanical cleaning (brushes, scrapers, hydro-blasting). Rotary brushes, metal scrapers, and high-pressure water jets dislodge hard scale and stubborn deposits from tube walls. Good for rigid, inorganic fouling and heavy buildup. The risk is surface damage: aggressive contact can scratch or thin soft tubes such as titanium, brass, and thin-wall alloys, so technique matters.
-
Chemical cleaning – acid. Acid solutions dissolve mineral scale such as calcium carbonate, rust, and hard-water deposits. Highly effective against inorganic scale, but the wrong concentration or contact time will corrode the base metal, and the spent solution needs careful neutralization and disposal.
-
Chemical cleaning – alkaline. Alkaline agents break down the organic films, grease, and oil-based foulants that acids cannot touch. A good fit for hydrocarbon and biological sludges, but they act slowly on mineral scale and usually need heat and a long soak to work.
-
Chemical cleaning – chelant. Chelating agents bind metal ions and lift deposits gently instead of attacking with acid, which protects corrosion-prone alloys. Ideal when tube metallurgy is sensitive. The trade-off is cost and speed: chelants cost more and work more slowly than mineral acids.
-
Online cleaning. Continuous or intermittent methods (sponge balls, brushes, or flow manipulation) run while the unit stays in service, which removes most of the downtime. Excellent for keeping light fouling in check, but they cannot remove heavy or hardened deposits and they add ongoing operational complexity.
-
Offline cleaning. The exchanger comes out of service for manual, chemical, or high-pressure treatment. It delivers the most thorough results and suits severe fouling, but it requires shutdown, labor, and lost production, which makes schedule timing critical.
Treat the list as a starting point, then match the method to your fouling pattern, tube material, and maintenance calendar.
Heat Transfer Efficiency Decline Under Fouling Over Time
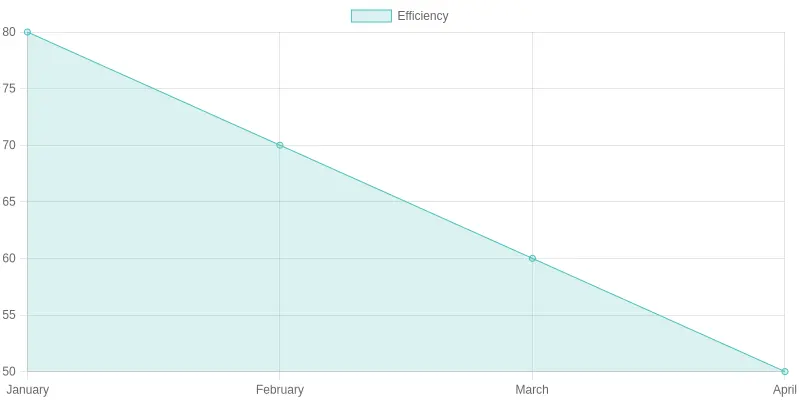
The chart below plots two scenarios on the same axes: operating time (months) on the x-axis and heat transfer efficiency (%) on the y-axis. The red line shows an exchanger that is never cleaned, while the green sawtooth line shows one cleaned on a planned six-month schedule. All figures are illustrative and meant to show the trend, not to predict a specific unit.
What the two lines tell you
- No cleaning schedule (red): deposits build up layer by layer, so efficiency slides from 100% to roughly 56% over 24 months. Nothing resets it, so the curve is smooth.
- Planned cleaning every 6 months (green): each cleaning brings efficiency back close to baseline, which produces the sawtooth. The unit stays in the 92-99% band instead of degrading into the 50s.
Illustrative data series
| Operating Time (months) | No Cleaning Schedule (%) | Planned Cleaning Every 6 Months (%) |
|---|---|---|
| 0 | 100 | 100 |
| 3 | 94 | 94 |
| 6 | 88 | 99 |
| 9 | 82 | 94 |
| 12 | 76 | 99 |
| 15 | 70 | 94 |
| 18 | 65 | 99 |
| 21 | 59 | 94 |
| 24 | 56 | 92 |
Illustrative data – actual decline rates depend on fluid chemistry, flow velocity, tube material, and operating temperature.
Why timing beats intensity
The gap between the two lines is the whole argument. A fouled exchanger makes the system work harder: pumps run longer, the furnace fires hotter, and more energy goes in for the same heat moved. At 56% efficiency you are often paying to move heat you never capture.
Well-timed cleaning avoids that trap because it keeps deposits from hardening into a scale that is expensive to remove. A soft, freshly formed fouling layer wipes off during a short outage. The same deposit left for two years can demand aggressive chemical cleaning, tube repair, or full bundle replacement. That is where maintenance cost actually climbs.
Three things equipment teams can act on:
- Set the interval from data, not habit. Trend the approach temperature or pressure drop and clean when the curve starts to steepen – usually before efficiency drops more than 5-8%.
- Choose tube material for the fouling you expect. Smoother, more corrosion-resistant surfaces foul more slowly, stretching the interval and lowering lifetime cost.
- Protect the whole system, not just the exchanger. Tight, well-maintained components everywhere in your operation – from heat exchangers to the rolling stock your crews rely on – keep uptime predictable.
The sawtooth line is not luck. It is what cleaning on a schedule, instead of reacting to a failure, looks like.
Tube Material Choices and Their Effect on Fouling
The tube material you select shapes far more than the initial purchase price. Surface finish decides how easily deposits grip the wall – a rough, pitted bore gives foulants an anchor, while a smooth, polished surface lets them slide off during routine cleaning. Corrosion resistance matters because corrosion products often become part of the foulant layer themselves, adding thickness and insulating the wall. Thermal conductivity sets the penalty you pay once a film does form: a highly conductive tube forgives a thin deposit, while a low-conductivity one turns a light layer into a real efficiency drain. Those three traits steer cleaning frequency and long-term maintenance cost.
- Carbon steel: The cheapest option with excellent thermal conductivity, but it corrodes quickly in water service. Rust and iron oxide bond tightly to the tube wall, so you clean more often and watch maintenance cost climb over the equipment’s life.
- Stainless steel (304/316): Smooth surfaces and solid corrosion resistance slow both deposit formation and attack. The molybdenum in 316 adds chloride tolerance, stretching cleaning intervals in aggressive water – though its lower thermal conductivity trims heat-transfer efficiency slightly.
- Copper alloys (admiralty brass, cupronickel): Naturally hostile to biofouling, since dissolved copper is toxic to marine organisms. Cupronickel shines in high-velocity seawater, but copper alloys are vulnerable to ammonia corrosion and erosion if chemistry drifts.
- Titanium: Outstanding corrosion resistance and a very smooth, non-reactive surface make it the standout in seawater and brackish duty. It shrugs off nearly every common foulant, dramatically reducing cleaning frequency – but poor thermal conductivity and a steep price tag mean the highest upfront investment.
In practice the choice is a balance. A material that resists corrosion and presents a smooth face to foulants will cut cleaning frequency, but if it gives up thermal conductivity, operating cost can rise to compensate. Weigh the capital outlay against the cleaning labor and downtime each option invites; the cheapest tube on the shelf is rarely the cheapest to own.
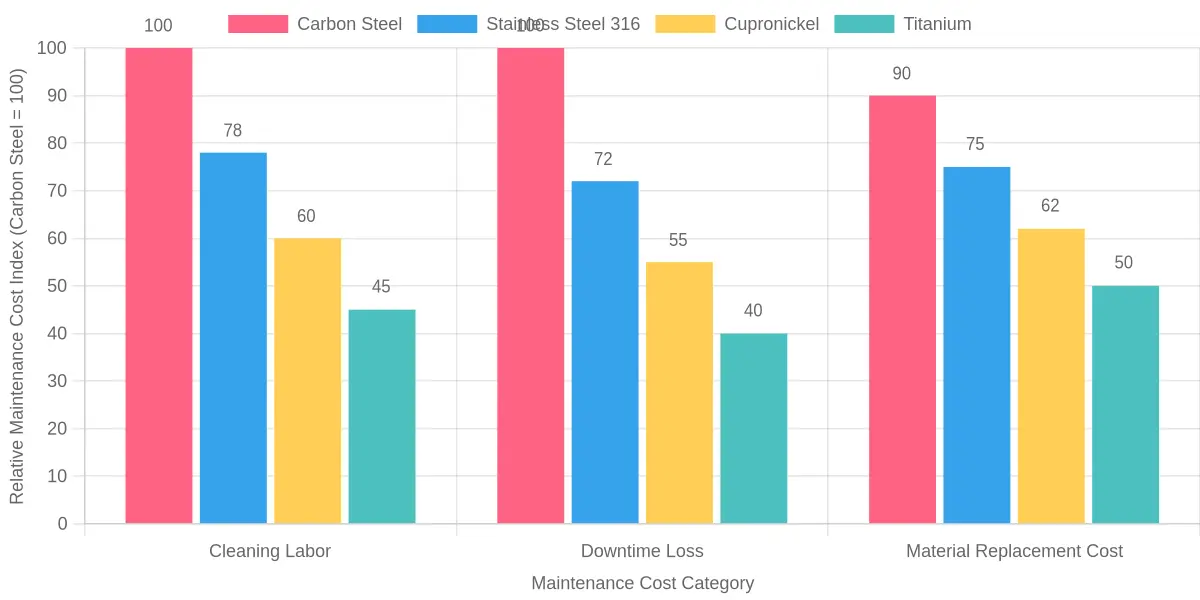
Chart data (illustrative relative indices)
X-axis: Maintenance Cost Category (Cleaning Labor, Downtime Loss, Material Replacement Cost)
Y-axis: Relative Maintenance Cost Index (carbon steel cleaning labor and downtime = 100)
| Cost Category | Carbon Steel | Stainless Steel 316 | Cupronickel | Titanium |
|---|---|---|---|---|
| Cleaning Labor | 100 | 78 | 60 | 45 |
| Downtime Loss | 100 | 72 | 55 | 40 |
| Material Replacement Cost | 90 | 75 | 62 | 50 |
| Total Index | 290 | 225 | 177 | 135 |
Caption: Titanium and cupronickel are the more expensive tubes to buy, but their cleaning-labor, downtime-loss, and replacement-cost indices all run well below carbon steel, so the 10-year total maintenance burden favors them. The figures are illustrative.
The Cleaning-Frequency vs. Material-Investment Trade-Off
The cheapest tube you can buy is almost never the cheapest tube to own. When fouling is the dominant failure mode, every dollar saved on tube material choices at the purchase order comes back as more aggressive cleaning schedules, more labor hours, and more lost production. The useful question is not “which bundle costs less up front?” but “which bundle costs less over its whole life?”
Total cost of ownership (TCO) for a heat exchanger bundles four cost streams into one number:
- Material – the upfront tube and shell investment.
- Cleaning labor – hours, chemicals, water, and waste disposal.
- Downtime – the value of production lost during every shutdown.
- Energy – the extra pumping and heat-transfer penalty created by fouled surfaces.
Lower-grade carbon steel may cost a fraction of a titanium bundle at purchase, but it corrodes and fouls faster, so it demands shorter cleaning intervals and longer outages. Premium alloys resist corrosion and hold a smoother surface, stretching the gap between cleanings – at a higher entry price.
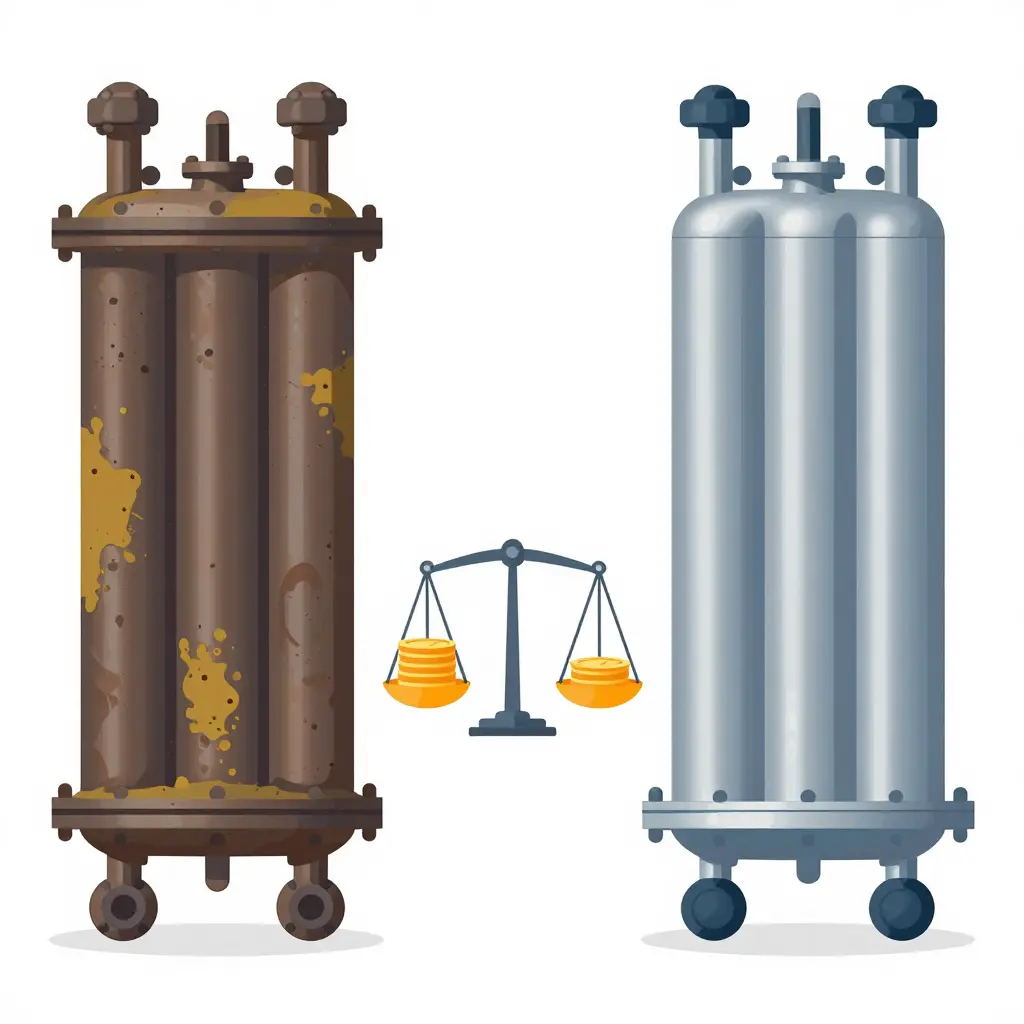
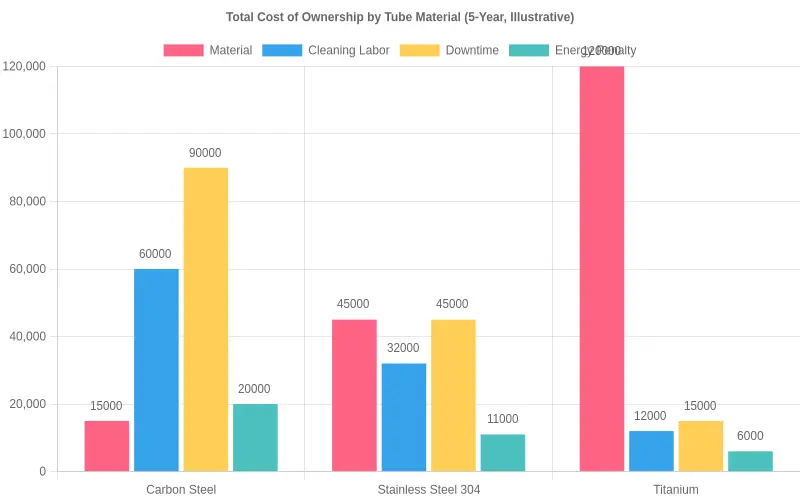
The pattern is blunt: carbon steel wins the material line and loses everywhere else. Stainless steel lands in the middle. Titanium costs the most up front yet reclaims much of that through lower cleaning labor, less downtime, and steadier energy performance.
Compare TCO over a five- to ten-year horizon, not over the invoice. When downtime is expensive or the fluid is aggressive, the premium material usually pays for itself. When in doubt, apply the same discipline you would to any long-life component – investing in quality up front to cut total cost. Before you commit, weigh four decision factors:
- Process fluid corrosivity – how fast will the tube wall attack and pit?
- Fouling tendency – how quickly does scale or deposition build?
- Cleaning accessibility – can you clean in place, or does it require a full teardown?
- Uptime value – what does one hour of lost production actually cost you?
Get them right and maintenance cost becomes something you forecast rather than something that surprises you.
Related Maintenance and Equipment Guides
Fouling control is one part of a wider discipline: keeping rotating and thermal equipment reliable while managing total cost of ownership. The references below extend the monitoring, material-selection, and asset-efficiency themes discussed above.
- For operations considering condition-based maintenance, this overview of fleet tire-pressure monitoring systems for safety explains how continuous tracking of pressure and performance supports preventive schedules and early fault detection.
- When replacement parts shape lifecycle economics, this guide to investing in quality landscaping tires illustrates how specifying durable components lowers downtime and total cost of ownership.
- For a practical tool that applies the same pressure-and-performance logic to routine upkeep, the tire pressure calculator offers a hands-on reference for maintenance planning across equipment types.
Key Takeaways for Maintenance Planning
Heat exchanger fouling is a controllable cost, not an act of nature. Two decisions do most of the work: when you clean, and what tube material you specify. Get those right and the rest of the program is easier to run. Condition-based cleaning paired with appropriately rated materials keeps heat transfer performance steady and holds total maintenance cost down.
Actionable Steps for Your Team
- Treat fouling as a managed variable, not a fixed expense. Track fouling rates over time so you can plan interventions before efficiency drops.
- Move from calendar-based to condition-based cleaning schedules. Use measured performance data to clean when it pays off, rather than on an arbitrary interval.
- Match tube material choices to the real operating environment. Alloys that resist the dominant fouling and corrosion mechanism last longer and cut unplanned downtime.
- Quantify total maintenance cost, not just cleaning spend. Include downtime, energy penalties, and labor when comparing options.
- Review performance after every cycle. Feed what you learn back into your schedule and material standards.
With those practices in place, maintenance planning becomes a routine rather than a series of emergencies. The savings and reliability gains accumulate over each operating cycle, and the exchangers stay closer to design performance for longer.